In this report
1. Executive summary
June was a two-sided month for Ottawa. Job postings climbed to 8,831, the highest in a year. They were up 2.5% from May and 21.9% from a year ago. At the same time, postings are still about 19.5% below a normal June. So this looks like more recovery from the winter low, not a boom. Meanwhile, the local unemployment rate rose to 6.8%, its first monthly increase in a while. That comes against a well-documented, ongoing reduction of the federal public service, a sector that weighs heavily on Ottawa's job market. Education hiring is the bright spot this month, while retail and food openings for students look thinner. Into the summer, postings usually firm a little as seasonal hiring continues, though the level should stay below a full spring.
2. Regional spotlight
This month two forces pull in opposite directions, and together they say something no single section does. On one side, the public base that the employers list is built on is being reshaped by an ongoing reduction of the federal public service, and Ottawa's unemployment rate rose for the first time in months, to 6.8%. On the other side, education hiring is having a strong June. Educational services nearly doubled to 11.8% of coded postings, jobs in education and social services rose to 16.8%, and two school boards and the University of Ottawa sit at the very top of the employer list. The likely reason is seasonal: schools and colleges hire heavily for the fall in June and July. So one part of Ottawa's public sector is cooling while another is in its busy season. One month is not a trend, and the education lift will fade after summer. The action is concrete. Pre-position education and health placements now while those openings are open, and open a conversation with federal-adjacent employers about redeployment before the fall, when the seasonal school hiring ends and any federal cuts may be clearer.
3. Job postings & trend
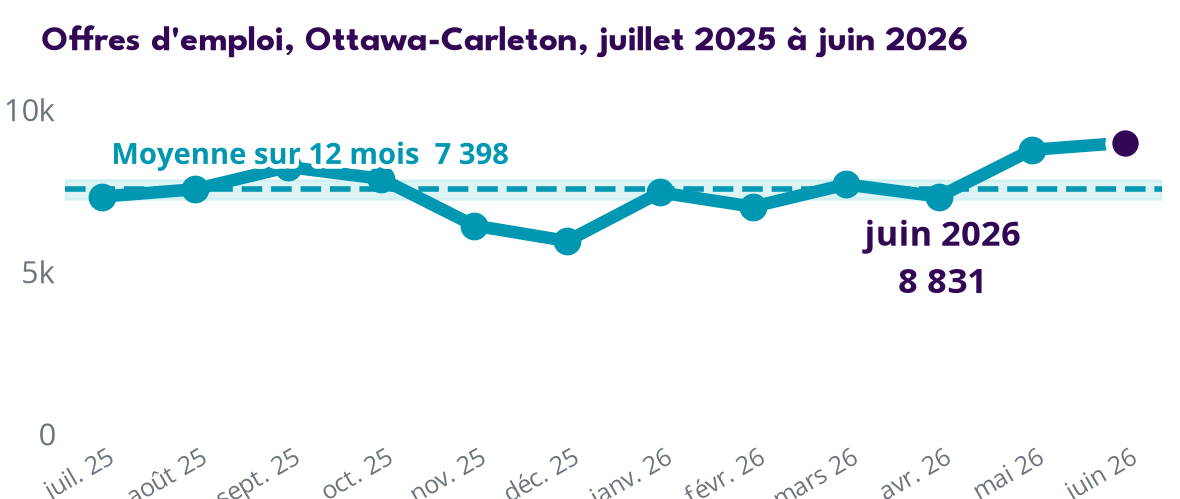
Postings reached 8,831 in June. That is up 2.5% from May and 21.9% from a year ago, and it is the highest level in twelve months. Two things keep this from being a boom. First, the year-ago comparison is measured against a weak June 2025, so the yearly jump looks bigger than the real gain. Second, postings are still about 19.5% below Ottawa's typical June over the past five years. So the market is recovering, not overheating. Into the summer, seasonal hiring usually firms postings modestly, though the level should stay below a full spring.
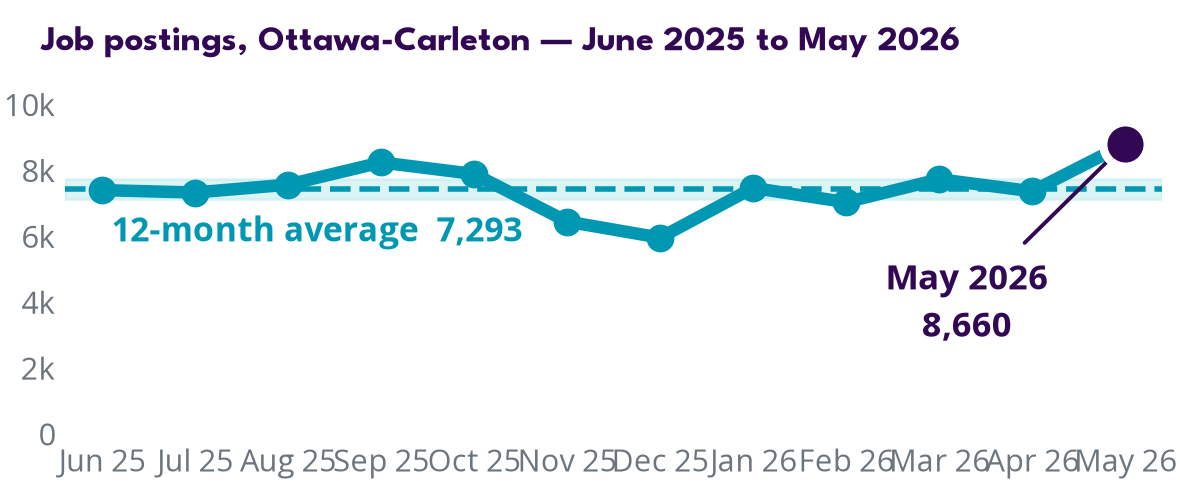
| Month | Postings | vs. prior month |
|---|---|---|
| July 2025 | 7,170 | n/a |
| August 2025 | 7,398 | ▲ 3.2% |
| September 2025 | 8,084 | ▲ 9.3% |
| October 2025 | 7,722 | ▼ 4.5% |
| November 2025 | 6,279 | ▼ 18.7% |
| December 2025 | 5,801 | ▼ 7.6% |
| January 2026 | 7,298 | ▲ 25.8% |
| February 2026 | 6,858 | ▼ 6.0% |
| March 2026 | 7,546 | ▲ 10.0% |
| April 2026 | 7,172 | ▼ 5.0% |
| May 2026 | 8,614 | ▲ 20.1% |
| June 2026 | 8,831 | ▲ 2.5% |
4. Top industries
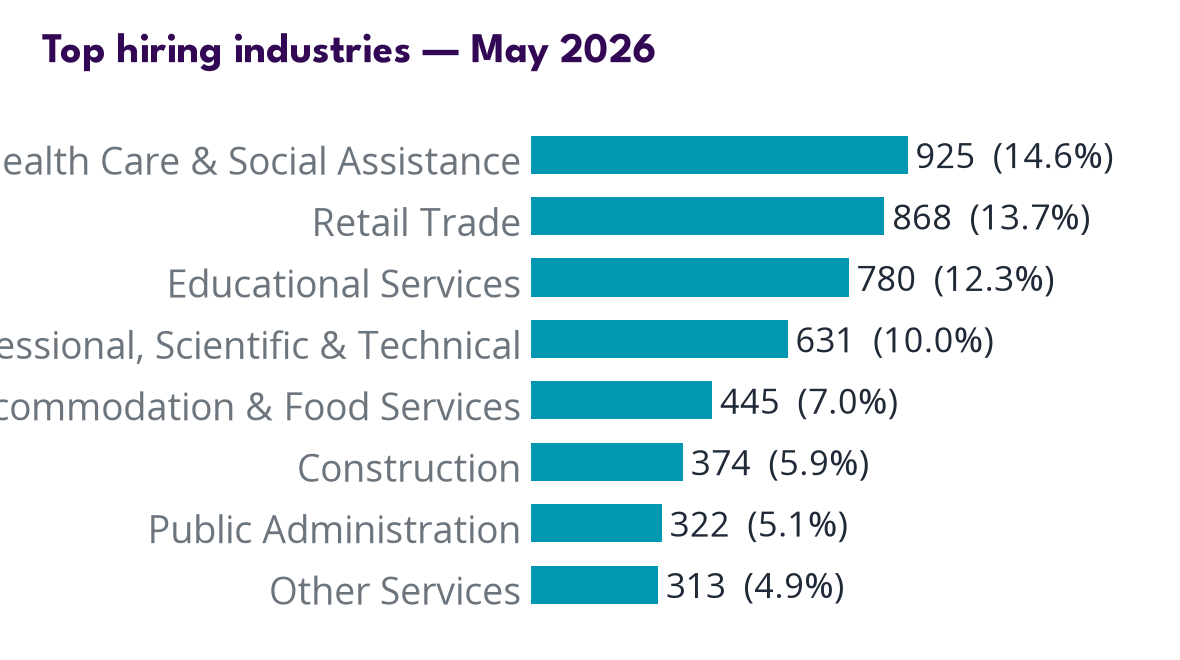
Health care and social assistance is the largest sector, at 15.2% of coded postings (1,294). Educational services rose sharply to 11.8% (1,007), nearly double its share three months ago. Professional, scientific and technical services is close behind at 11.8% (1,003). Retail trade (10.5%) and accommodation and food services (7.8%) both cooled over the same three months. The education jump is large, but one month is not enough to call it a real shift. It most likely reflects seasonal spring and summer hiring by schools. For someone planning summer programs, the read is simple. Point job-seekers toward education and health openings now, and expect retail demand to stay soft.
| Industry | Postings | Share (classified) |
|---|---|---|
| Health Care & Social Assistance | 1,294 | 15.2% |
| Educational Services | 1,007 | 11.8% |
| Professional, Scientific & Technical | 1,003 | 11.8% |
| Retail Trade | 896 | 10.5% |
| Accommodation & Food Services | 665 | 7.8% |
| Construction | 610 | 7.2% |
| Other Services | 531 | 6.2% |
| Admin & Support Services | 478 | 5.6% |
5. Top occupations
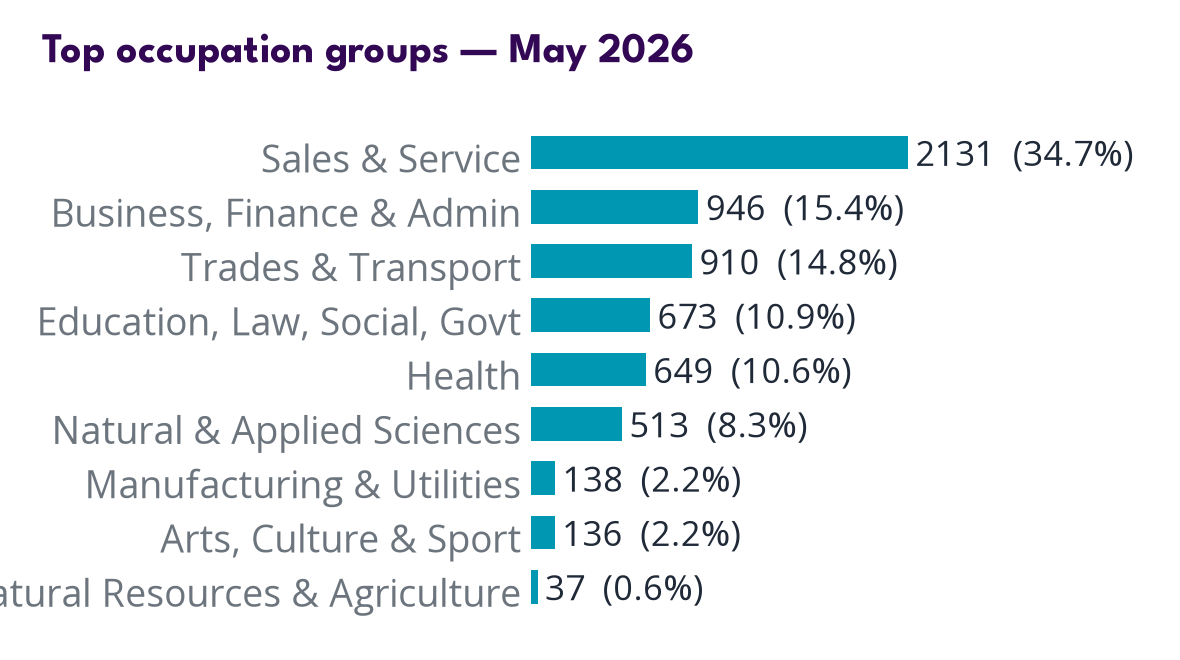
Sales and service occupations are still the largest group at 26.6% (2,347). But that share fell almost 8 points since March. Jobs in education, law, social, community and government services rose to 16.8% (1,482), up about 6 points. Natural and applied sciences jobs also rose, to 12.4% (1,095). These are three-month share moves and likely carry a seasonal component, so read them as movement to confirm, not a lasting change. The drop in sales and service points to fewer of the retail and food jobs students usually rely on over the summer. That is worth watching for youth employment programs.
| Occupation group | Postings | Share (classified) |
|---|---|---|
| Sales & Service | 2,347 | 26.6% |
| Education, Law, Social, Govt | 1,482 | 16.8% |
| Business, Finance & Admin | 1,458 | 16.5% |
| Trades & Transport | 1,180 | 13.4% |
| Natural & Applied Sciences | 1,095 | 12.4% |
| Health | 746 | 8.4% |
| Arts, Culture & Sport | 212 | 2.4% |
| Manufacturing & Utilities | 190 | 2.2% |
| Management | 77 | 0.9% |
| Natural Resources & Agriculture | 43 | 0.5% |
6. Education in demand
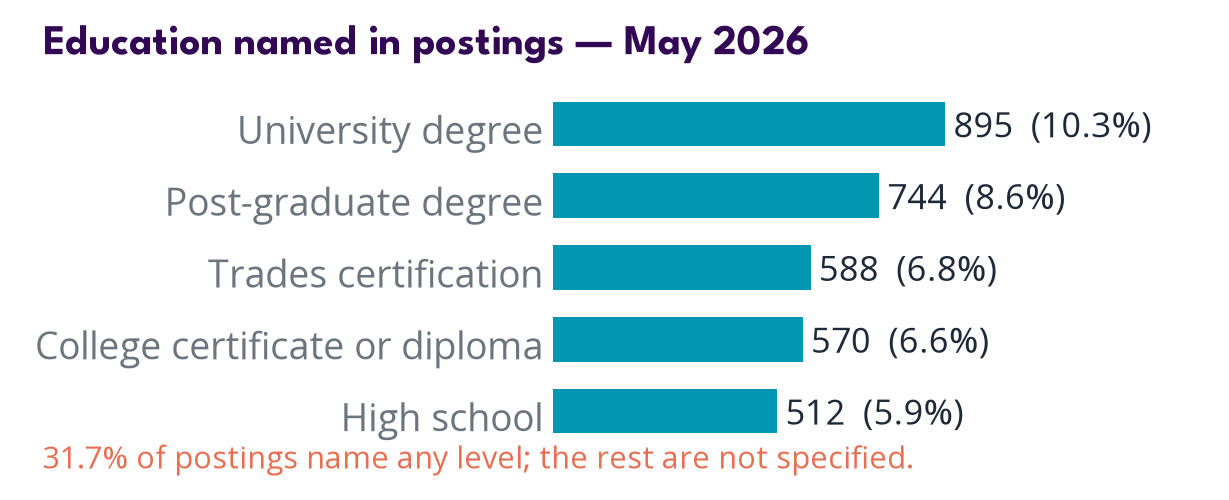
About one in three postings (33.4%, or 2,952) names an education level. University degrees lead at 10.6%, followed by college certificates or diplomas at 8.3%, post-graduate degrees at 7.8%, trades certification at 7.3% and high school at 7.0%. The other two-thirds do not name a level at all. That is normal for job ads and not a data flaw. The takeaway for planners and job-seekers is that most Ottawa employers are not screening on a single credential, so experience and skills matter as much as a diploma for most openings.
| Level named | Postings | Share (of all) |
|---|---|---|
| Not specified | 5,879 | 66.6% |
| University degree | 936 | 10.6% |
| College certificate or diploma | 730 | 8.3% |
| Post-graduate degree | 688 | 7.8% |
| Trades certification | 647 | 7.3% |
| High school | 618 | 7.0% |
7. Skills in demand
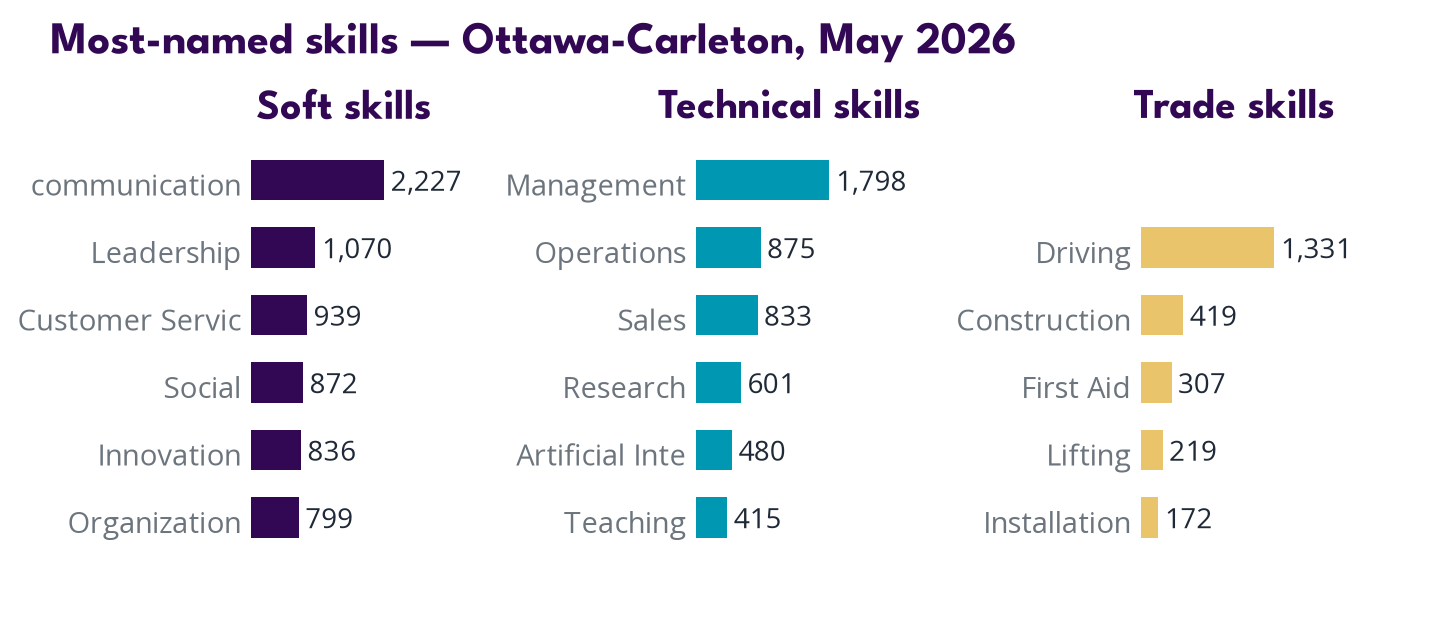
Skills were listed on 95.2% of postings this month. The most-named skills are soft skills: communication (3,826), customer service (1,924) and organizational skills (1,632). On the technical side, management (1,913), sales (879) and operations (770) lead. Driving (1,362) tops the trade skills. Artificial intelligence (AI) was named in just 2.4% of postings (212 of 8,831). So despite the headlines, AI is still a small part of what Ottawa employers ask for. Communication and customer service remain the core. A note on method: Second Cut, our data layer, augments, repairs, backfills, and cleans the posting data we receive, and reads it alongside other labour market signals. The skills figures use these corrected tags, which remove false reads such as AI hiring disclaimers.
8. Language requirements
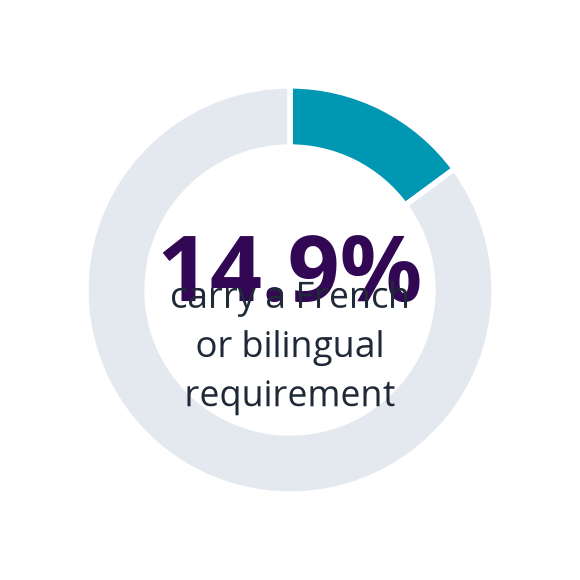
17.5% of Ottawa postings require French or bilingual ability, 1,548 of 8,831 postings.
| Requirement | Postings | Share (of all) |
|---|---|---|
| French required (not bilingual) | 763 | 8.6% |
| Bilingual | 785 | 8.9% |
| French or bilingual (total) | 1,548 | 17.5% |
9. Type of work
Most Ottawa postings are for permanent work: 88.1% (7,777). Contract roles are 7.7% (680) and temporary roles 4.2% (374). A seasonal tag appears on 2.6% of postings. Because so much of the advertised work is permanent, the recent rise in Employment Insurance is more likely to reflect ongoing-job loss than seasonal work ending. The postings cannot tell us who is actually filing claims, so this is a read to weigh, not a proven link. For counsellors, it suggests clients are competing mostly for lasting roles, not short-term fill-ins.
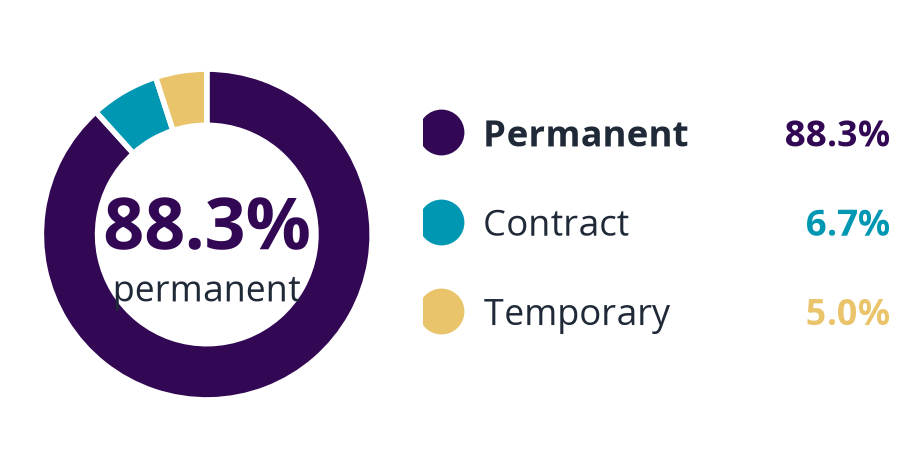
- Permanent: 7,777 (88.1%)
- Contract: 680 (7.7%)
- Temporary: 374 (4.2%)
- Seasonal (overlay): 228 (2.6%)
10. Advertised wages
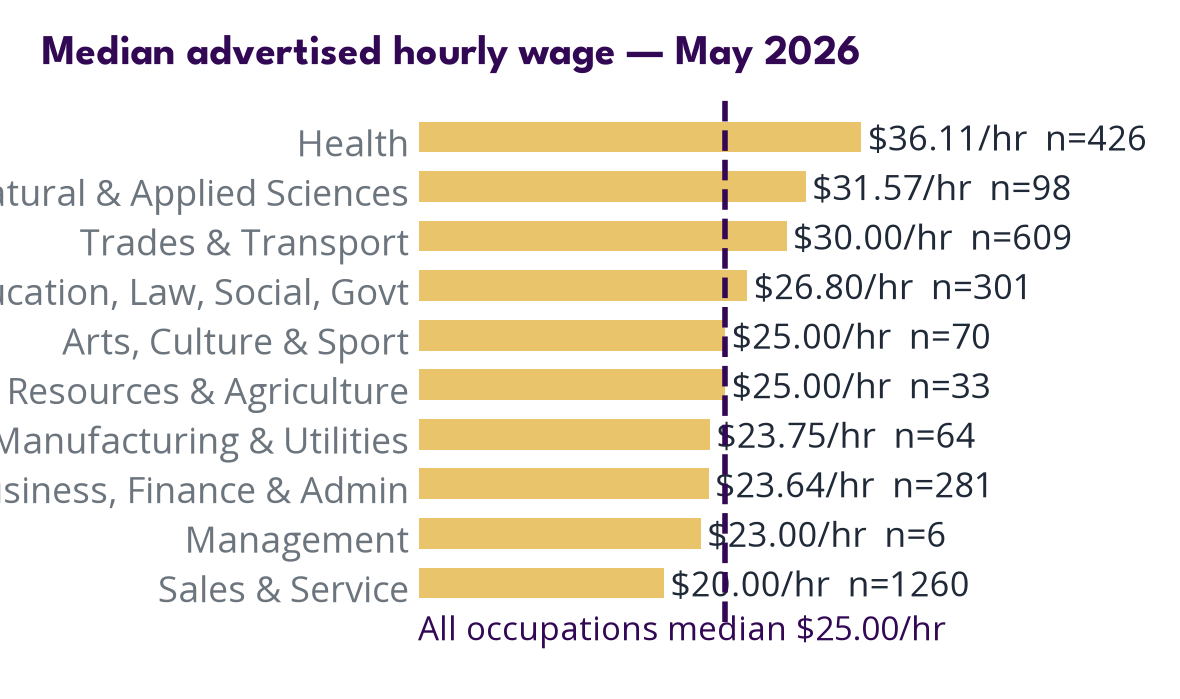
The median advertised wage held at $25.00 an hour. A quarter of postings advertise $20.00 an hour or less, and a quarter advertise $35.00 or more. Wages appear on 45.1% of postings (3,980), and these are advertised rates, not what people are finally paid. The largest occupation group, sales and service, usually pays below the median. So wage-subsidy and top-up programs should target that gap under the midpoint, not the middle number itself.
| Occupation group | Median (hourly) | Postings with wage |
|---|---|---|
| Health | $37.62/hr | 464 |
| Natural & Applied Sciences | $35.00/hr | 208 |
| Education, Law, Social, Govt | $31.89/hr | 571 |
| Management | $30.00/hr | 23 |
| Trades & Transport | $28.13/hr | 775 |
| Business, Finance & Admin | $25.00/hr | 389 |
| Arts, Culture & Sport | $25.00/hr | 86 |
| Natural Resources & Agriculture | $22.00/hr | 41 |
| Manufacturing & Utilities | $22.00/hr | 114 |
| Sales & Service | $20.00/hr | 1309 |
11. Top employers
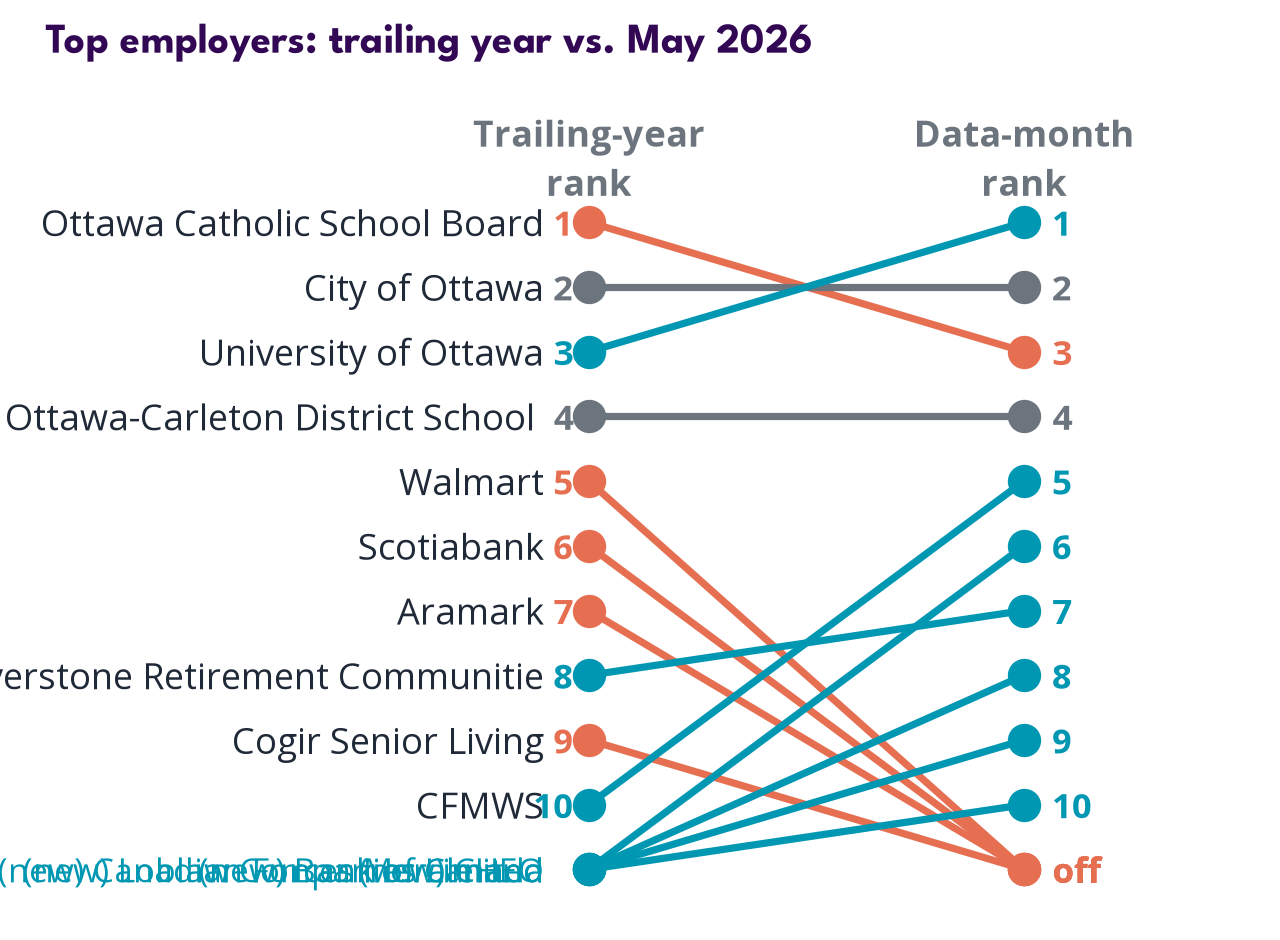
Public and institutional employers dominate the top of the list. The Ottawa Catholic School Board leads with 362 postings, followed by the University of Ottawa (336) and the Ottawa-Carleton District School Board (124). CFMWS (91), the City of Ottawa (71), CHEO (58) and the Bank of Canada (50) also appear. This concentration is Ottawa's strength and its risk. The same public base is being reshaped by an ongoing reduction of the federal public service, with a return-to-office change also underway. If those cuts deepen, the region would be exposed, though the effect is not yet visible in these postings.
| Rank | Employer | Postings (trailing year) |
|---|---|---|
| 1. | Ottawa Catholic School Board | 1,617 |
| 2. | University of Ottawa | 1,538 |
| 3. | City of Ottawa | 1,357 |
| 4. | Ottawa-Carleton District School Board | 780 |
| 5. | CFMWS | 660 |
| 6. | Scotiabank | 528 |
| 7. | Walmart | 523 |
| 8. | Riverstone Retirement Communities | 500 |
| 9. | Aramark | 475 |
| 10. | Cogir Senior Living | 450 |
12. Unemployment
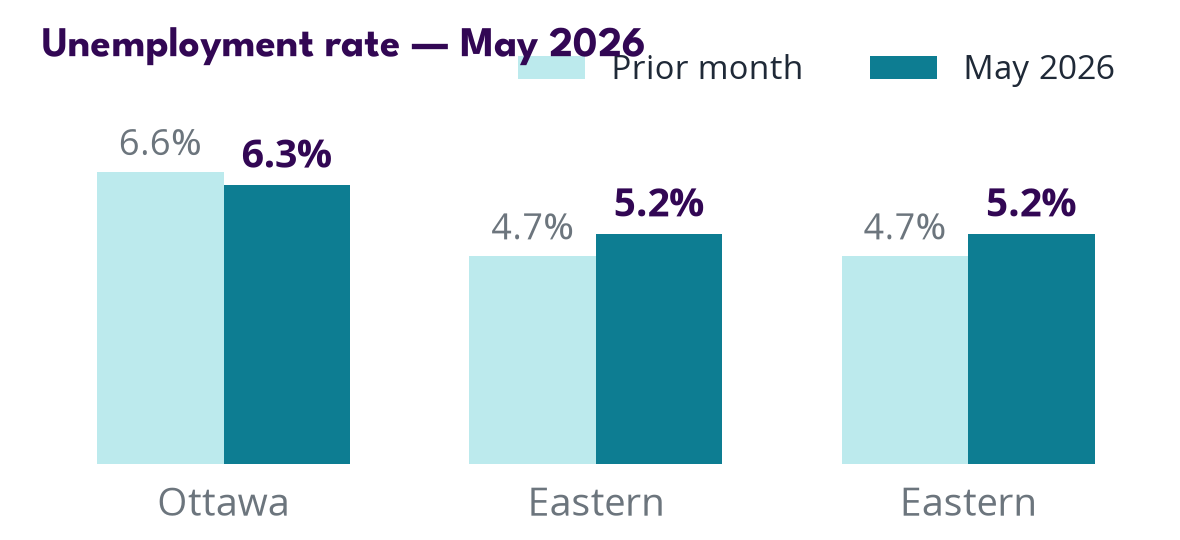
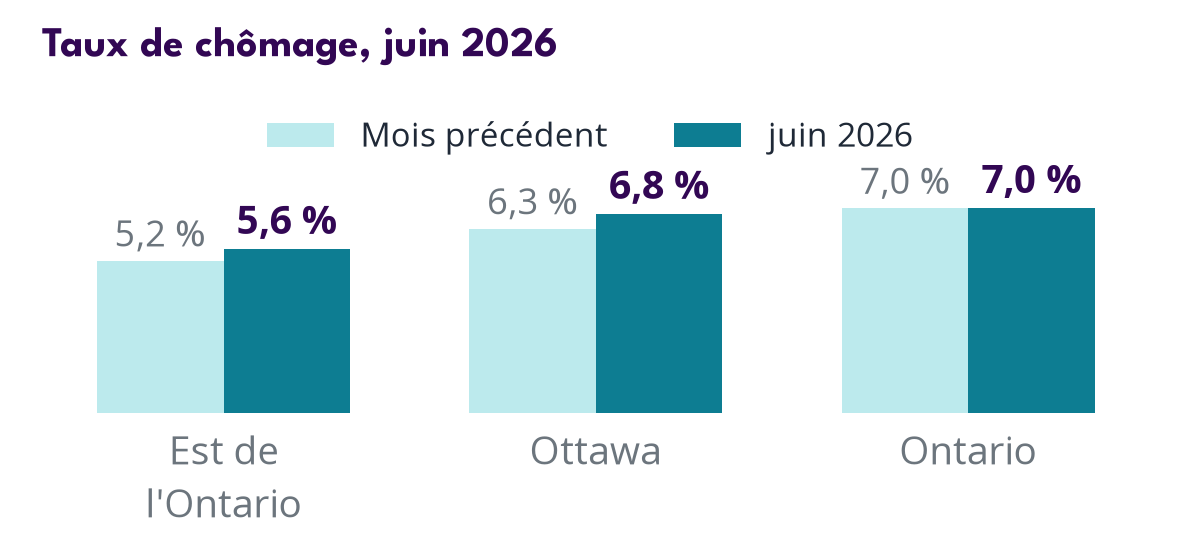
Ottawa's unemployment rate rose to 6.8% in June, up 0.5 points from 6.3%. This is the first monthly increase after a stretch of flat or falling readings, so one month is not yet a trend. It is the number to watch next month. The rise sits against two things: a documented, ongoing drawdown of the federal public service, and a provincial job market that is flat to softening, with Ontario holding at 7.0%. We are not showing a year-over-year change for the rate. The year-ago figure was held to a floor of 7.1% by a federal adjustment, so any yearly improvement would look better than it really is.
13. Employment Insurance beneficiaries
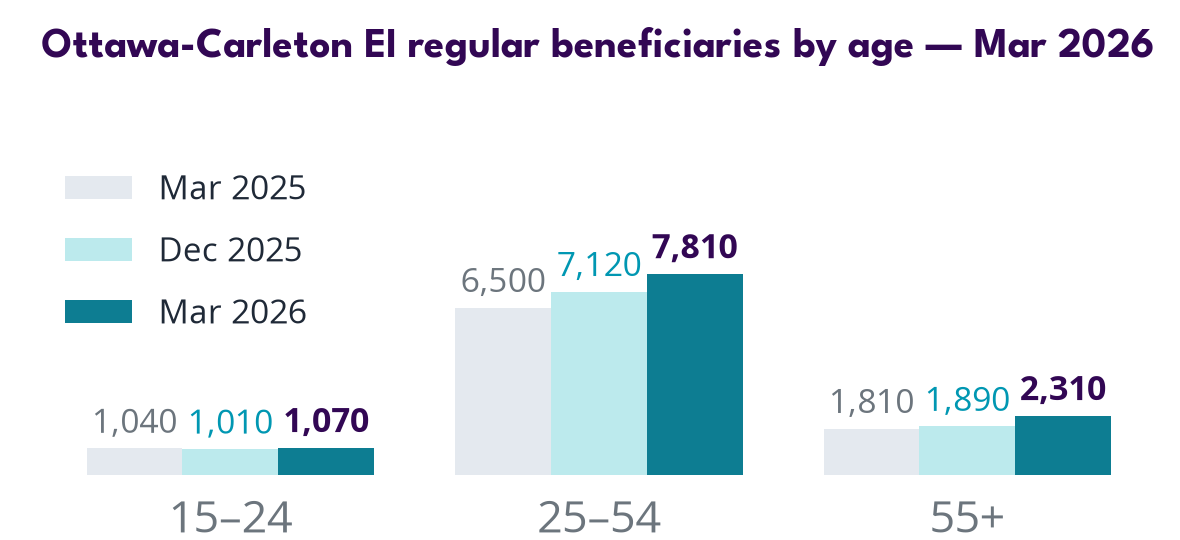
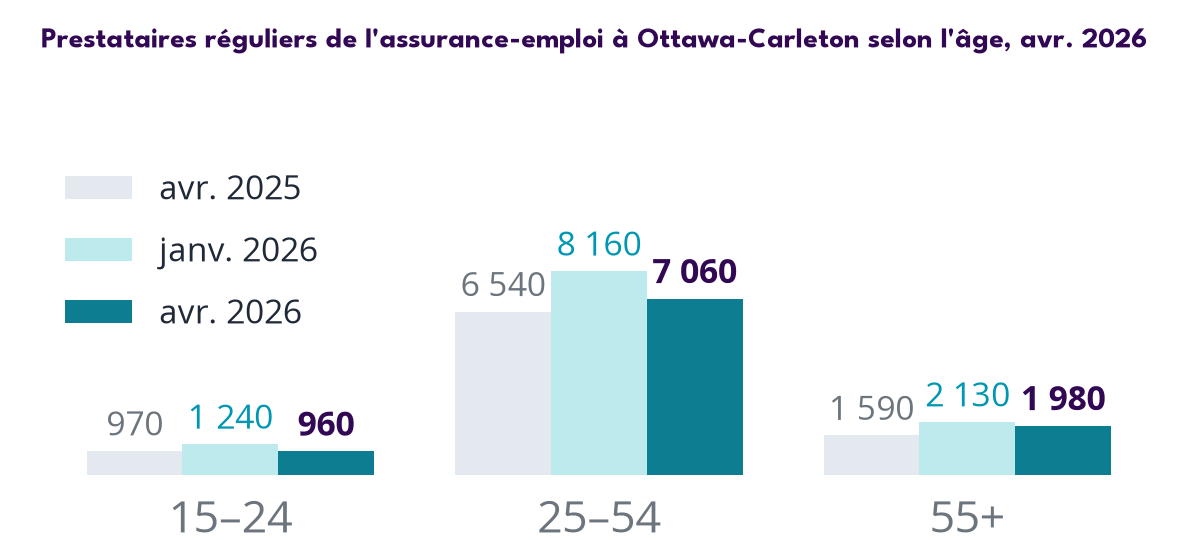
Employment Insurance figures are for April 2026, so they run two months behind the postings and unemployment data. Ottawa had about 10,000 beneficiaries. That is down 13.3% from the winter quarter, but up 9.9% from a year ago. So there are fewer claimants than in winter, yet more than a year ago. The standout is older workers: beneficiaries aged 55 and over were up 24.5% from a year ago. That may be an early sign of the federal drawdown reaching older workers, which could show in claims before it shows in postings. It is a signal to watch, not a confirmed cause.
| Group | Apr 2025 | Jan 2026 | Apr 2026 | YoY |
|---|---|---|---|---|
| Both · 15-24 | 970 | 1,240 | 960 | -1.0% |
| Both · 25-54 | 6,540 | 8,160 | 7,060 | +8.0% |
| Both · 55+ | 1,590 | 2,130 | 1,980 | +24.5% |
| Both · Total 15+ | 9,100 | 11,540 | 10,000 | +9.9% |
| Males · 15-24 | 660 | 930 | 720 | +9.1% |
| Males · 25-54 | 4,220 | 5,530 | 4,710 | +11.6% |
| Males · 55+ | 1,070 | 1,440 | 1,300 | +21.5% |
| Males · Total 15+ | 5,940 | 7,890 | 6,730 | +13.3% |
| Females · 15-24 | 310 | 320 | 240 | -22.6% |
| Females · 25-54 | 2,330 | 2,630 | 2,360 | +1.3% |
| Females · 55+ | 530 | 700 | 680 | +28.3% |
| Females · Total 15+ | 3,170 | 3,640 | 3,270 | +3.2% |
14. Additional resources

YourNextJob.ca
Job board, job map, career ladders, and training across Cornwall, SD&G, P-R, Akwesasne, and Ottawa.
Visit yournextjob.ca →
LabourMarketInfo.com
The 40 occupations that employ the most people locally: age, gender, education pathways, posting counts, and average advertised wages.
Check it out →
LMI Help Desk: your local LMI source
Have a specific labour-market question? Our analyst is waiting to hear from you.
Send email →15. Methodology & sources
Data platform. Figures are drawn from Second Cut, LPT & Co.'s labour-market intelligence platform. Second Cut augments, repairs, backfills, and cleans the incoming data, and reads it alongside other labour market signals before anything is published.
Job postings. WE Data (formerly YNJ), with Second Cut's cleanup: Kijiji removed, bilingual posting duplicates removed, same-employer same-title reposts within 4 days collapsed, employer alias normalization, NAICS 561310 excluded from the industry chart only.
Coverage this month. 0 of 8,831 postings carried no NAICS code; 326 agency postings excluded from the industry view.
Unemployment. Statistics Canada Tables 14-10-0354-01 (regional EI rates) and 14-10-0287-01 (Ontario monthly LFS). EI beneficiaries. Table 14-10-0323-01 (reference month is two months prior to the data month).
Wages. Median advertised hourly wage from WE Data (formerly YNJ); advertised, not paid.
Dans ce rapport
- Sommaire
- Pleins feux sur la région
- Offres d'emploi et tendance
- Principaux secteurs
- Principales professions
- Niveaux de scolarité recherchés
- Compétences demandées
- Exigences linguistiques
- Type d'emploi
- Salaires affichés
- Principaux employeurs
- Chômage
- Prestations d'assurance-emploi
- Ressources supplémentaires
- Méthodologie et sources
1. Sommaire
Le mois de juin a présenté deux visages pour Ottawa. Les offres d'emploi ont grimpé à 8 831, le plus haut niveau en un an. Elles étaient en hausse de 2,5 % par rapport à mai et de 21,9 % sur un an. En même temps, les offres demeurent environ 19,5 % sous la normale d'un mois de juin. Il s'agit donc d'une reprise qui se poursuit après le creux de l'hiver, et non d'un véritable essor. Par ailleurs, le taux de chômage local a augmenté à 6,8 %, sa première hausse mensuelle depuis un moment. Cela survient dans un contexte de réduction continue et bien documentée de la fonction publique fédérale, un secteur qui pèse lourd dans le marché du travail d'Ottawa. L'embauche dans l'enseignement est le point positif ce mois-ci, tandis que les postes en commerce de détail et en restauration pour les étudiants semblent plus rares. À l'approche de l'été, les offres se raffermissent habituellement un peu à mesure que l'embauche saisonnière se poursuit, même si le niveau devrait demeurer sous celui observé en pleine saison printanière.
2. Pleins feux sur la région
Ce mois-ci, deux forces tirent en sens contraires, et ensemble elles disent quelque chose qu'aucune section ne dit seule. D'un côté, la base publique sur laquelle repose la liste des employeurs est remodelée par une réduction continue de la fonction publique fédérale, et le taux de chômage d'Ottawa a augmenté pour la première fois en plusieurs mois, à 6,8 %. De l'autre, l'embauche dans l'enseignement connaît un bon mois de juin. Le service d'enseignement a presque doublé, à 11,8 % des offres codées, les emplois en enseignement et services sociaux ont augmenté à 16,8 %, et deux conseils scolaires ainsi que l'Université d'Ottawa se trouvent tout en haut de la liste des employeurs. La raison probable est saisonnière : les écoles et les collèges embauchent beaucoup en juin et juillet pour l'automne. Une partie du secteur public d'Ottawa se refroidit donc pendant qu'une autre est en pleine saison. Un mois ne constitue pas une tendance, et la poussée de l'enseignement s'estompera après l'été. Voici le geste concret à poser. Préparez dès maintenant les placements en enseignement et en santé pendant que ces postes sont ouverts, et amorcez une conversation avec les employeurs proches du fédéral au sujet du redéploiement avant l'automne, quand l'embauche scolaire saisonnière prendra fin et que d'éventuelles compressions fédérales pourraient être plus claires.
3. Offres d'emploi et tendance
Les offres ont atteint 8 831 en juin. C'est une hausse de 2,5 % par rapport à mai et de 21,9 % sur un an, et il s'agit du niveau le plus élevé en douze mois. Deux éléments empêchent de parler d'un essor. Premièrement, la comparaison sur un an se mesure par rapport à un mois de juin 2025 faible, de sorte que le bond annuel paraît plus grand que le gain réel. Deuxièmement, les offres demeurent environ 19,5 % sous la normale d'un mois de juin à Ottawa au cours des cinq dernières années. Le marché se rétablit donc, sans surchauffer. À l'approche de l'été, l'embauche saisonnière raffermit habituellement les offres de façon modeste, même si le niveau devrait demeurer sous celui observé en pleine saison printanière.
| Mois | Offres | vs mois précédent |
|---|---|---|
| juillet 2025 | 7 170 | s.o. |
| août 2025 | 7 398 | ▲ 3,2 % |
| septembre 2025 | 8 084 | ▲ 9,3 % |
| octobre 2025 | 7 722 | ▼ 4,5 % |
| novembre 2025 | 6 279 | ▼ 18,7 % |
| décembre 2025 | 5 801 | ▼ 7,6 % |
| janvier 2026 | 7 298 | ▲ 25,8 % |
| février 2026 | 6 858 | ▼ 6,0 % |
| mars 2026 | 7 546 | ▲ 10,0 % |
| avril 2026 | 7 172 | ▼ 5,0 % |
| mai 2026 | 8 614 | ▲ 20,1 % |
| juin 2026 | 8 831 | ▲ 2,5 % |
4. Principaux secteurs
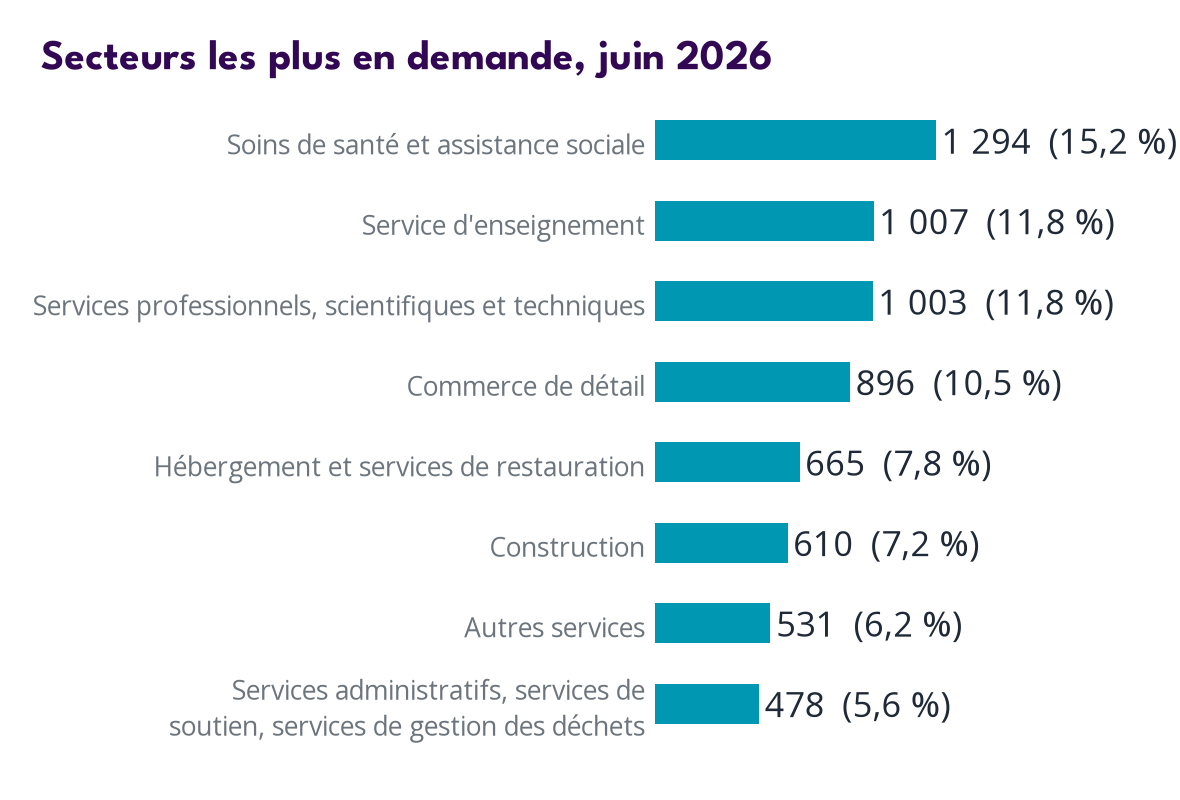
Les soins de santé et assistance sociale forment le plus grand secteur, à 15,2 % des offres codées (1 294). Le service d'enseignement a fortement augmenté à 11,8 % (1 007), soit presque le double de sa part il y a trois mois. Les services professionnels, scientifiques et techniques suivent de près à 11,8 % (1 003). Le commerce de détail (10,5 %) et l'hébergement et services de restauration (7,8 %) ont tous deux ralenti au cours des mêmes trois mois. Le bond de l'enseignement est important, mais un seul mois ne suffit pas pour parler d'un véritable changement. Il reflète fort probablement l'embauche saisonnière du printemps et de l'été par les écoles. Pour qui planifie des programmes d'été, le message est simple. Orientez dès maintenant les chercheurs d'emploi vers les postes en enseignement et en santé, et attendez-vous à ce que la demande dans le commerce de détail demeure faible.
| Secteur | Offres | Part (classées) |
|---|---|---|
| Soins de santé et assistance sociale | 1 294 | 15,2 % |
| Service d'enseignement | 1 007 | 11,8 % |
| Services professionnels, scientifiques et techniques | 1 003 | 11,8 % |
| Commerce de détail | 896 | 10,5 % |
| Hébergement et services de restauration | 665 | 7,8 % |
| Construction | 610 | 7,2 % |
| Autres services | 531 | 6,2 % |
| Services administratifs, services de soutien, services de gestion des déchets | 478 | 5,6 % |
5. Principales professions
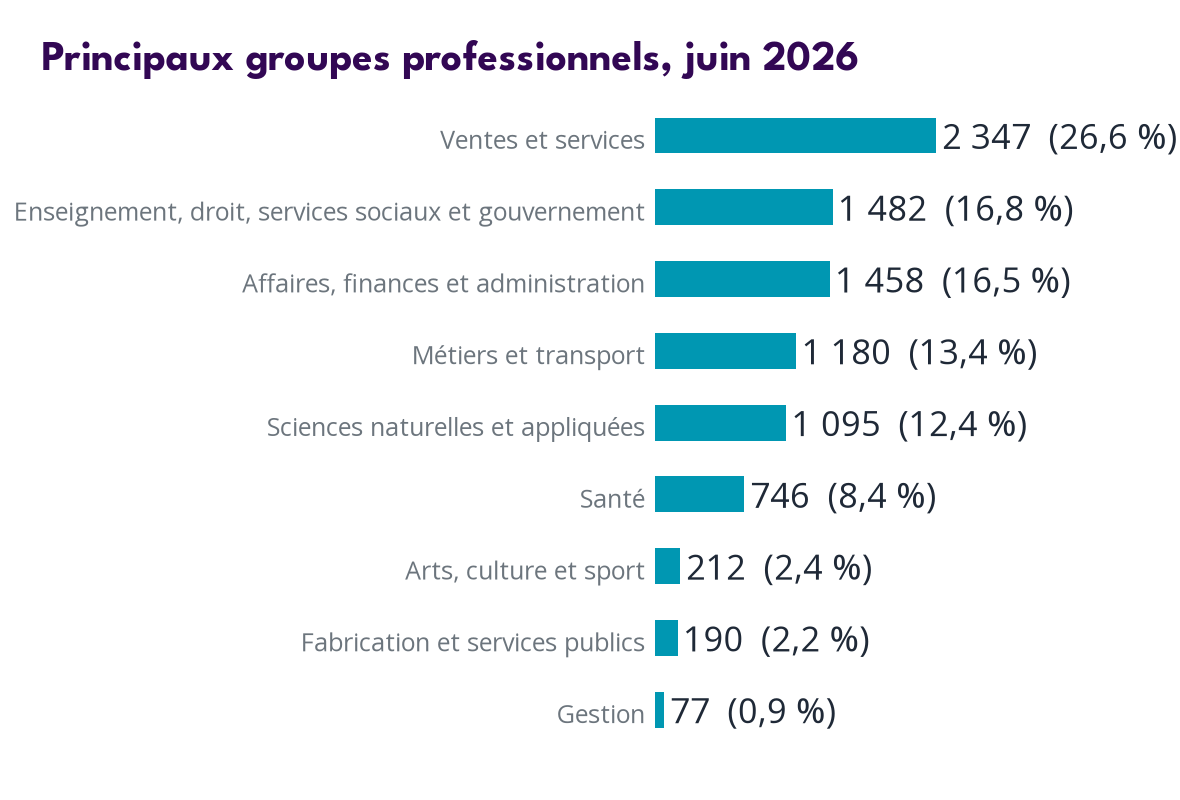
Les professions du commerce et services demeurent le plus grand groupe à 26,6 % (2 347). Mais cette part a reculé de près de 8 points depuis mars. Les emplois en enseignement, droit, services sociaux et gouvernement ont augmenté à 16,8 % (1 482), une hausse d'environ 6 points. Les emplois en sciences naturelles et appliquées ont aussi augmenté, à 12,4 % (1 095). Il s'agit de mouvements de parts sur trois mois qui comportent probablement une composante saisonnière, à lire donc comme un mouvement à confirmer, et non un changement durable. Le recul du commerce et services laisse entrevoir moins d'emplois dans le commerce de détail et la restauration sur lesquels les étudiants comptent habituellement l'été. Cela mérite une attention pour les programmes d'emploi jeunesse.
| Groupe de professions | Offres | Part (classées) |
|---|---|---|
| Ventes et services | 2 347 | 26,6 % |
| Enseignement, droit, services sociaux et gouvernement | 1 482 | 16,8 % |
| Affaires, finances et administration | 1 458 | 16,5 % |
| Métiers et transport | 1 180 | 13,4 % |
| Sciences naturelles et appliquées | 1 095 | 12,4 % |
| Santé | 746 | 8,4 % |
| Arts, culture et sport | 212 | 2,4 % |
| Fabrication et services publics | 190 | 2,2 % |
| Gestion | 77 | 0,9 % |
| Ressources naturelles et agriculture | 43 | 0,5 % |
6. Niveaux de scolarité recherchés
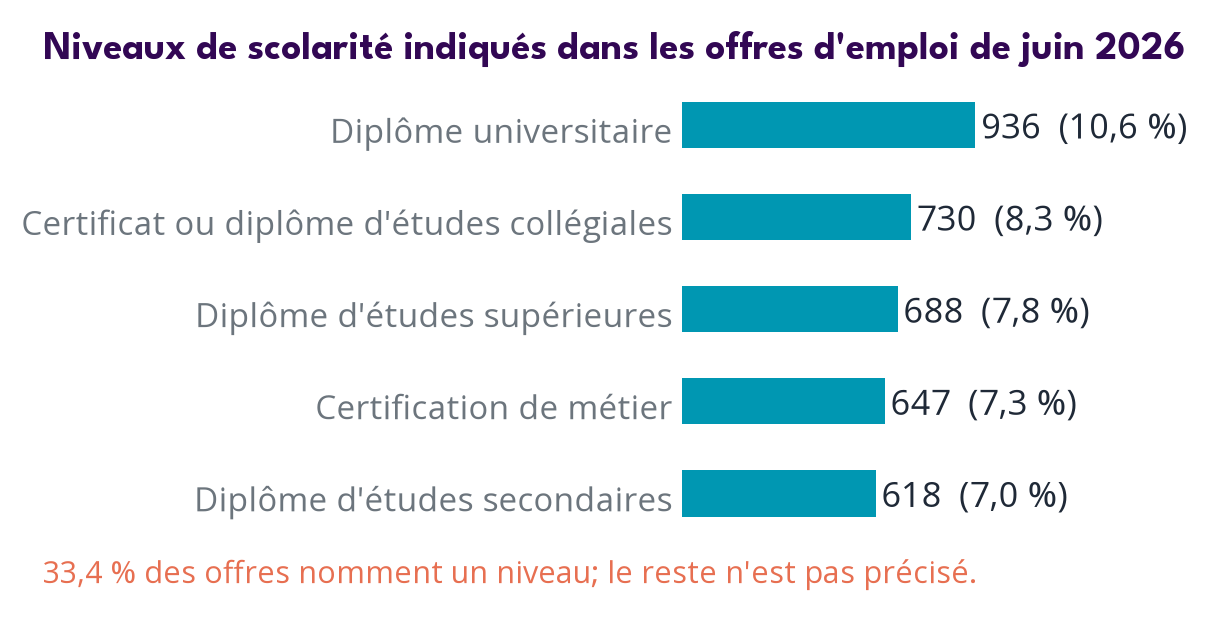
Environ une offre sur trois (33,4 %, soit 2 952) mentionne un niveau de scolarité. Les diplômes universitaires sont en tête à 10,6 %, suivis des certificats ou diplômes d'études collégiales à 8,3 %, des diplômes d'études supérieures à 7,8 %, de la certification de métier à 7,3 % et du diplôme d'études secondaires à 7,0 %. Les deux autres tiers ne mentionnent aucun niveau. C'est normal pour des offres d'emploi et ce n'est pas un défaut des données. Le constat pour les planificateurs et les chercheurs d'emploi est que la plupart des employeurs d'Ottawa ne filtrent pas selon un seul titre de compétence. L'expérience et les compétences comptent donc autant qu'un diplôme pour la plupart des postes.
| Niveau nommé | Offres | Part (de l'ensemble) |
|---|---|---|
| Non précisé | 5 879 | 66,6 % |
| Diplôme universitaire | 936 | 10,6 % |
| Certificat ou diplôme d'études collégiales | 730 | 8,3 % |
| Diplôme d'études supérieures | 688 | 7,8 % |
| Certification de métier | 647 | 7,3 % |
| Diplôme d'études secondaires | 618 | 7,0 % |
7. Compétences demandées
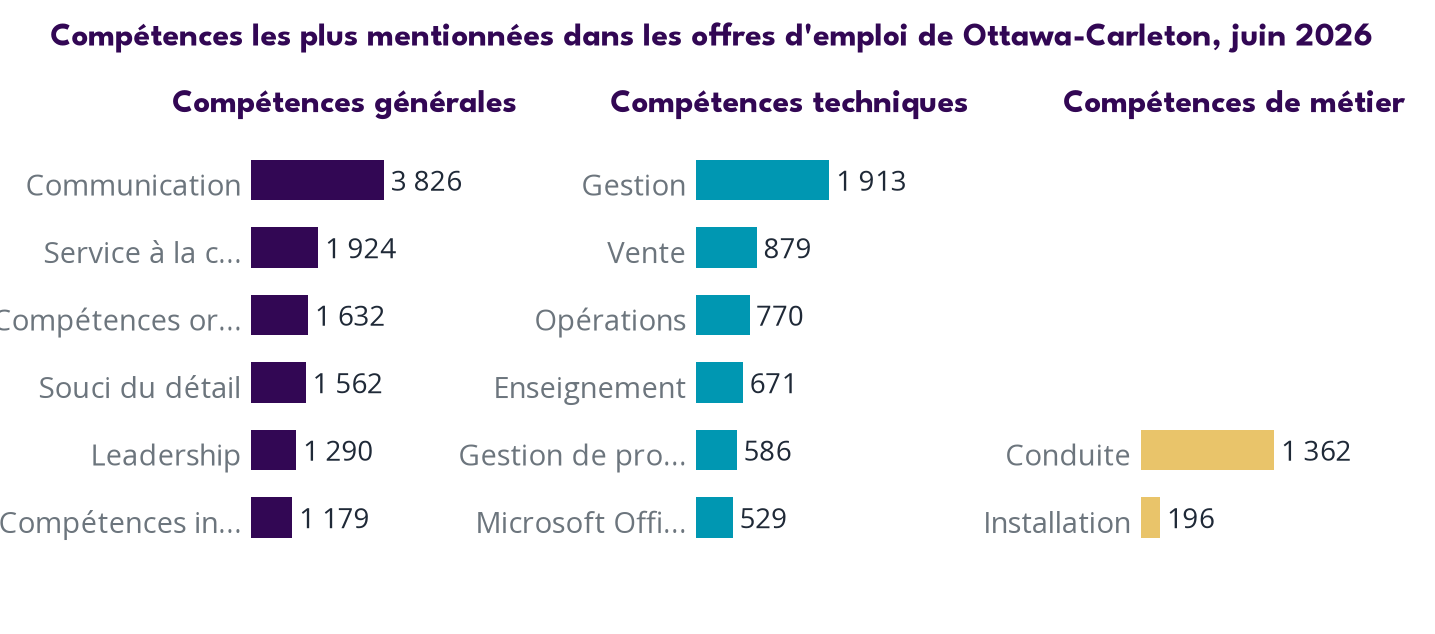
Des compétences étaient énumérées dans 95,2 % des offres ce mois-ci. Les compétences les plus nommées sont des compétences générales : communication (3 826), service à la clientèle (1 924) et compétences organisationnelles (1 632). Du côté technique, la gestion (1 913), la vente (879) et les opérations (770) sont en tête. La conduite (1 362) domine les compétences de métier. L'intelligence artificielle (IA) n'a été nommée que dans 2,4 % des offres (212 sur 8 831). Malgré les manchettes, l'IA demeure donc une petite partie de ce que demandent les employeurs d'Ottawa. La communication et le service à la clientèle restent au cœur des besoins. Une note sur la méthode : Second Cut, notre couche de données, enrichit, corrige, complète et nettoie les données d'offres que nous recevons, puis les met en contexte à l'aide d'autres signaux du marché du travail. Les chiffres sur les compétences reposent sur ces étiquettes corrigées, qui éliminent les fausses lectures, comme les mentions de l'IA dans les avis de recrutement.
8. Exigences linguistiques
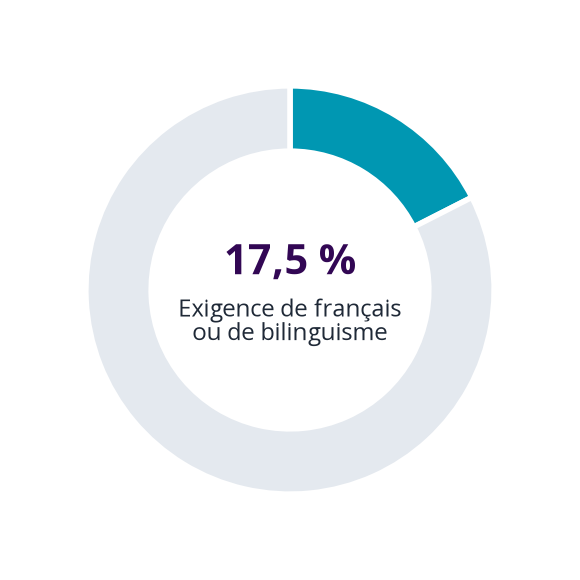
17,5 % des offres de Ottawa exigent le français ou le bilinguisme, soit 1 548 des 8 831 offres (l'union distincte).
| Exigence | Offres | Part (de l'ensemble) |
|---|---|---|
| Français exigé (non bilingue) | 763 | 8,6 % |
| Bilingue | 785 | 8,9 % |
| Français ou bilingue (total) | 1 548 | 17,5 % |
9. Type d'emploi
La plupart des offres d'Ottawa visent un emploi permanent : 88,1 % (7 777). Les postes contractuels représentent 7,7 % (680) et les postes temporaires 4,2 % (374). Une étiquette saisonnière figure sur 2,6 % des offres. Comme une si grande part du travail affiché est permanent, la récente hausse de l'assurance-emploi (AE) reflète plus probablement une perte d'emploi durable qu'une fin de travail saisonnier. Les offres ne peuvent nous dire qui dépose réellement des demandes, il s'agit donc d'un constat à pondérer, et non d'un lien prouvé. Pour les conseillers, cela laisse penser que les clients se disputent surtout des postes durables, et non des emplois de dépannage à court terme.
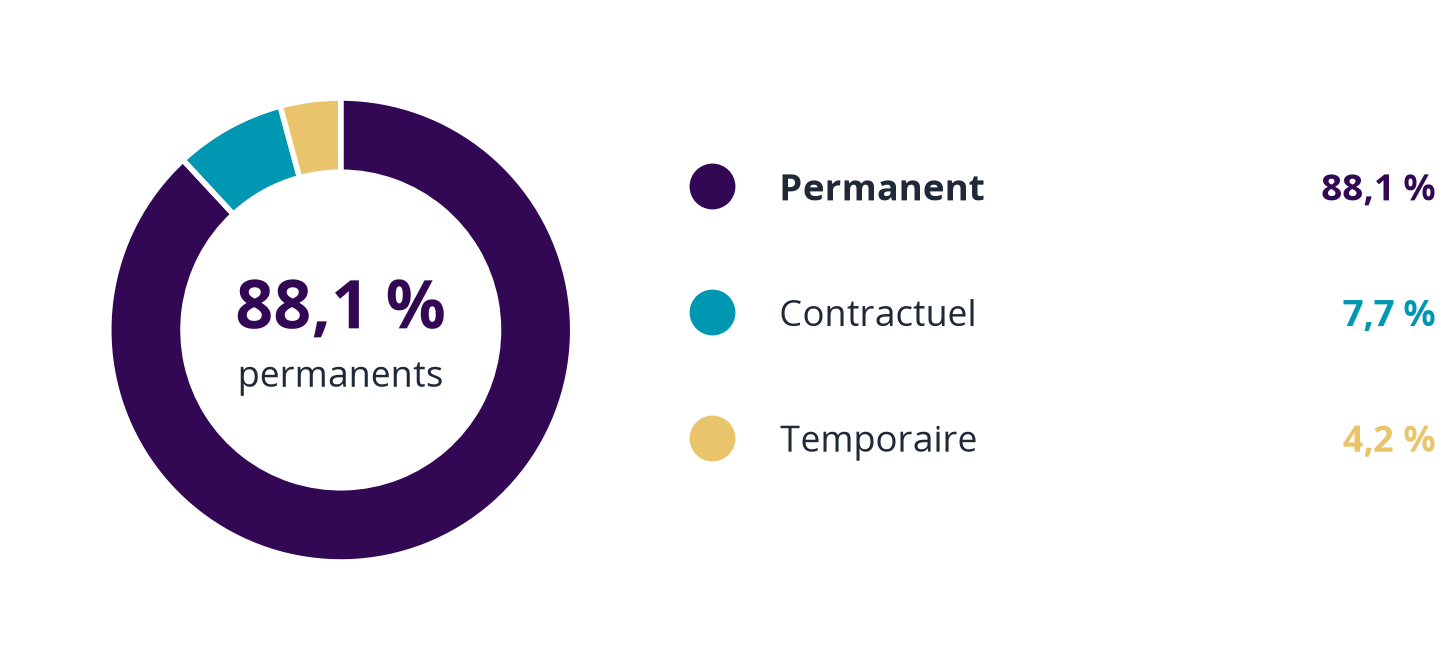
- Permanent: 7 777 (88,1 %)
- Contractuel: 680 (7,7 %)
- Temporaire: 374 (4,2 %)
- Saisonnier (superposé): 228 (2,6 %)
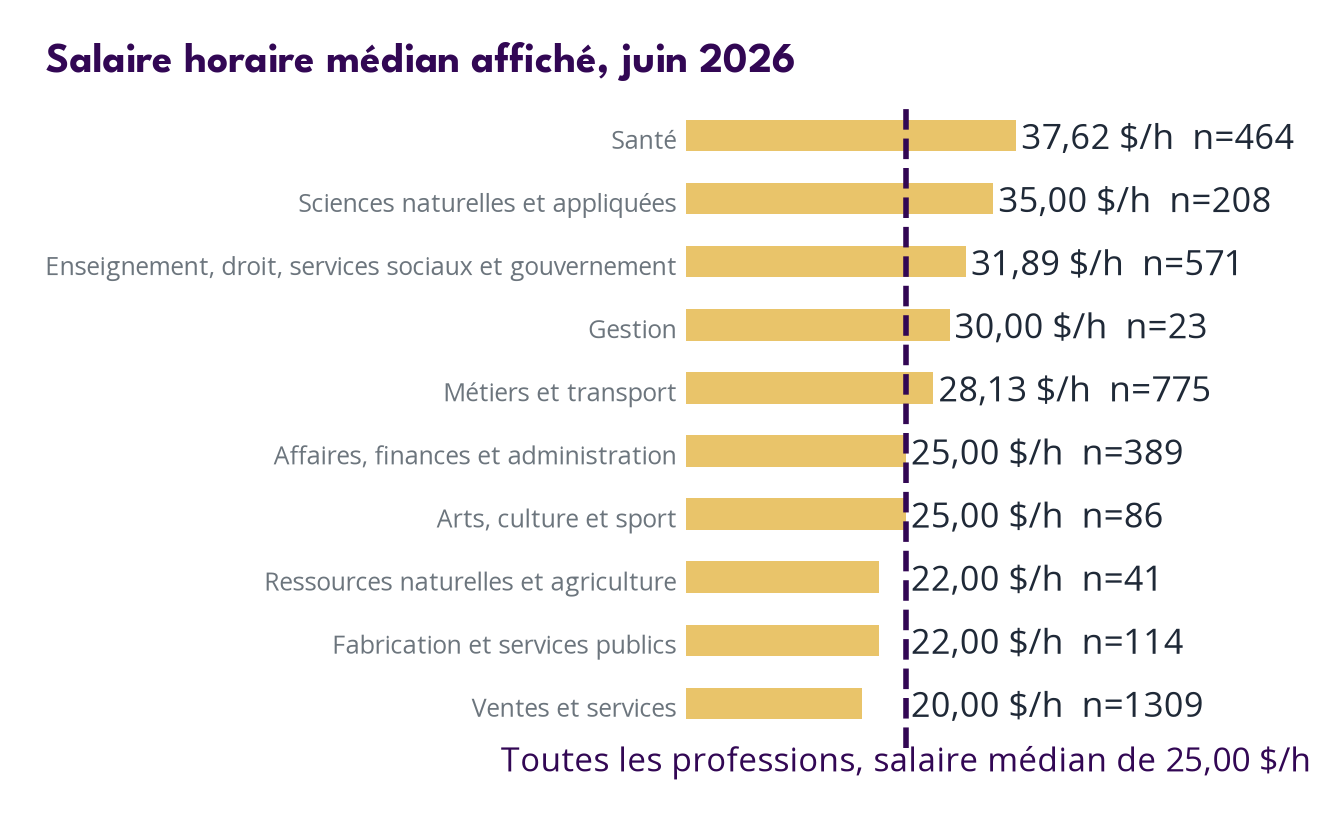
10. Salaires affichés
Le salaire médian affiché s'est maintenu à 25,00 $/h. Un quart des offres annoncent 20,00 $/h ou moins, et un quart annoncent 35,00 $ ou plus. Les salaires figurent dans 45,1 % des offres (3 980), et il s'agit de taux affichés, et non de ce que les gens sont finalement payés. Le plus grand groupe de professions, le commerce et services, paie habituellement moins que la médiane. Les programmes de subvention et de bonification salariales devraient donc viser cet écart sous le point médian, et non le chiffre du milieu lui-même.
| Groupe de professions | Médiane (horaire) | Offres avec salaire |
|---|---|---|
| Santé | 37,62 $/h | 464 |
| Sciences naturelles et appliquées | 35,00 $/h | 208 |
| Enseignement, droit, services sociaux et gouvernement | 31,89 $/h | 571 |
| Gestion | 30,00 $/h | 23 |
| Métiers et transport | 28,13 $/h | 775 |
| Affaires, finances et administration | 25,00 $/h | 389 |
| Arts, culture et sport | 25,00 $/h | 86 |
| Ressources naturelles et agriculture | 22,00 $/h | 41 |
| Fabrication et services publics | 22,00 $/h | 114 |
| Ventes et services | 20,00 $/h | 1 309 |
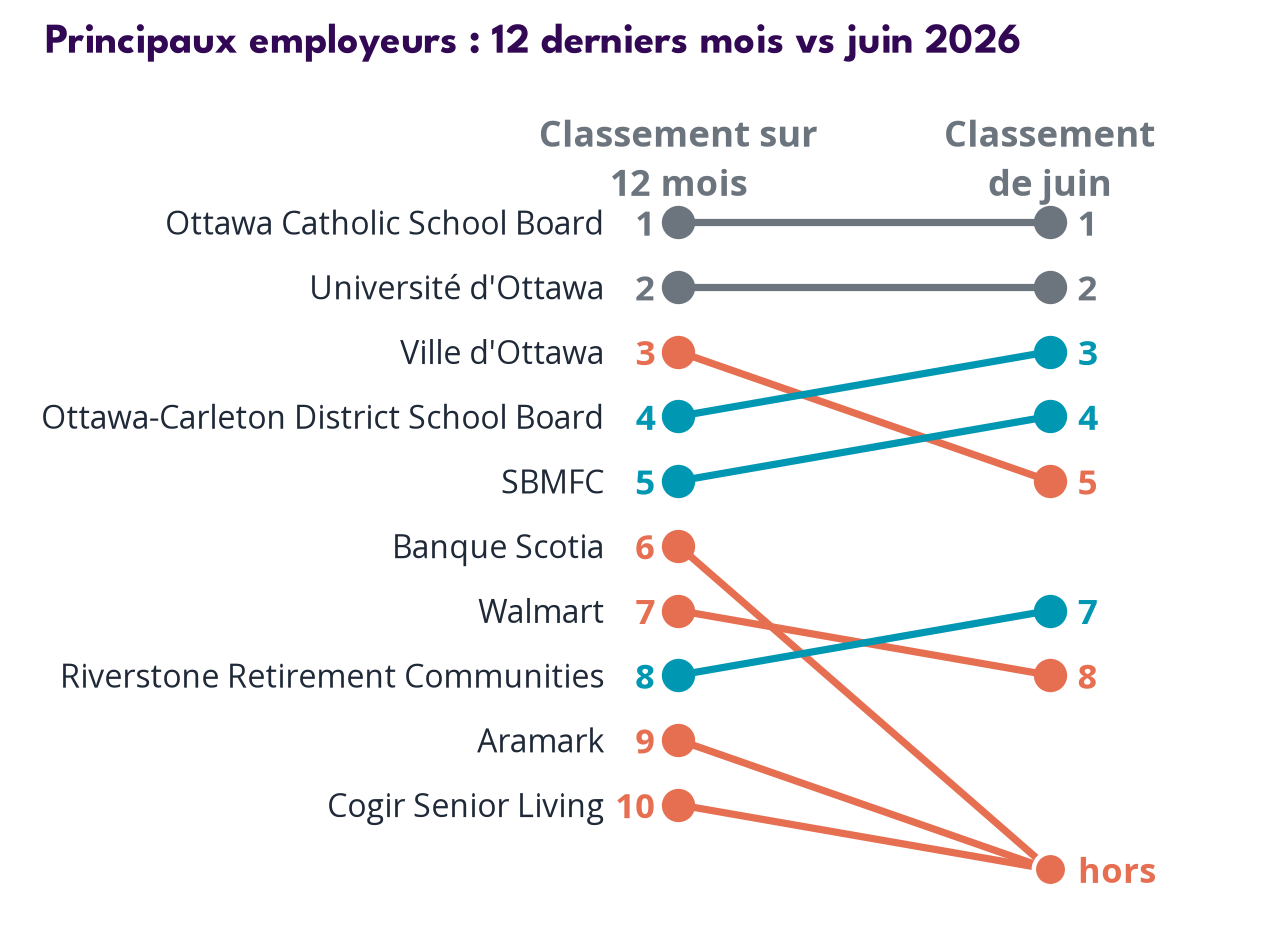
11. Principaux employeurs
Les employeurs publics et institutionnels dominent le haut de la liste. L'Ottawa Catholic School Board est en tête avec 362 offres, suivi de l'Université d'Ottawa (336) et de l'Ottawa-Carleton District School Board (124). La SBMFC (91), la Ville d'Ottawa (71), le CHEO (58) et la Banque du Canada (50) figurent aussi. Cette concentration est à la fois la force et le risque d'Ottawa. Cette même base publique est remodelée par une réduction continue de la fonction publique fédérale, avec aussi un retour au bureau en cours. Si ces compressions s'aggravent, la région serait exposée, même si l'effet n'est pas encore visible dans ces offres.
| Rang | Employeur | Offres (12 derniers mois) |
|---|---|---|
| 1. | Ottawa Catholic School Board | 1 617 |
| 2. | Université d'Ottawa | 1 538 |
| 3. | Ville d'Ottawa | 1 357 |
| 4. | Ottawa-Carleton District School Board | 780 |
| 5. | SBMFC | 660 |
| 6. | Banque Scotia | 528 |
| 7. | Walmart | 523 |
| 8. | Riverstone Retirement Communities | 500 |
| 9. | Aramark | 475 |
| 10. | Cogir Senior Living | 450 |
12. Chômage
Le taux de chômage d'Ottawa a augmenté à 6,8 % en juin, en hausse de 0,5 point par rapport à 6,3 %. Il s'agit de la première hausse mensuelle après une série de mois stables ou en baisse, un seul mois ne constitue donc pas encore une tendance. C'est le chiffre à surveiller le mois prochain. Cette hausse survient dans un double contexte : une réduction documentée et continue de la fonction publique fédérale, et un marché du travail provincial stable ou en léger repli, l'Ontario demeurant à 7,0 %. Nous ne montrons pas de variation sur un an pour le taux. Le chiffre de l'an dernier a été maintenu à un plancher de 7,1 % par un ajustement fédéral, de sorte que toute amélioration annuelle paraîtrait meilleure qu'elle ne l'est réellement.
13. Prestations d'assurance-emploi
Les chiffres de l'assurance-emploi (AE) portent sur avril 2026, ils accusent donc deux mois de retard sur les données des offres et du chômage. Ottawa comptait environ 10 000 prestataires. C'est une baisse de 13,3 % par rapport au trimestre d'hiver, mais une hausse de 9,9 % sur un an. Il y a donc moins de prestataires qu'en hiver, mais plus qu'il y a un an. Le fait marquant concerne les travailleurs plus âgés : les prestataires âgés de 55 ans et plus étaient en hausse de 24,5 % sur un an. Cela pourrait être un signe précoce que la réduction fédérale atteint les travailleurs plus âgés, ce qui pourrait apparaître dans les demandes avant d'apparaître dans les offres. C'est un signal à surveiller, et non une cause confirmée.
| Groupe | avr. 2025 | janv. 2026 | avr. 2026 | sur un an |
|---|---|---|---|---|
| Les deux sexes · 15-24 | 970 | 1 240 | 960 | -1,0 % |
| Les deux sexes · 25-54 | 6 540 | 8 160 | 7 060 | +8,0 % |
| Les deux sexes · 55+ | 1 590 | 2 130 | 1 980 | +24,5 % |
| Les deux sexes · Total 15 ans+ | 9 100 | 11 540 | 10 000 | +9,9 % |
| Hommes · 15-24 | 660 | 930 | 720 | +9,1 % |
| Hommes · 25-54 | 4 220 | 5 530 | 4 710 | +11,6 % |
| Hommes · 55+ | 1 070 | 1 440 | 1 300 | +21,5 % |
| Hommes · Total 15 ans+ | 5 940 | 7 890 | 6 730 | +13,3 % |
| Femmes · 15-24 | 310 | 320 | 240 | -22,6 % |
| Femmes · 25-54 | 2 330 | 2 630 | 2 360 | +1,3 % |
| Femmes · 55+ | 530 | 700 | 680 | +28,3 % |
| Femmes · Total 15 ans+ | 3 170 | 3 640 | 3 270 | +3,2 % |
14. Ressources supplémentaires
YourNextJob.ca
Babillard d'emplois, carte des emplois, parcours de carrière et formation à Cornwall, dans SD&G, P-R, Akwesasne et Ottawa.
Visiter yournextjob.ca →
LabourMarketInfo.com
Les 40 professions qui emploient le plus de gens localement : âge, genre, parcours de scolarité, nombre d'offres et salaires moyens affichés.
Découvrir →
Service d'aide en information sur le marché du travail (IMT)
Une question précise sur le marché du travail? Notre analyste est là pour vous répondre.
Écrire →15. Méthodologie et sources
Plateforme de données. Les chiffres proviennent de Second Cut, la plateforme de renseignements sur le marché du travail de LPT & Co. Second Cut enrichit, corrige, complète et nettoie les données reçues, et les met en contexte à l'aide d'autres signaux du marché du travail avant toute publication.
Offres d'emploi. WE Data (anciennement YNJ), avec le nettoyage de Second Cut : Kijiji retiré, doublons d'offres bilingues retirés, réaffichages du même employeur et même titre en moins de 4 jours regroupés, normalisation des alias d'employeurs, SCIAN 561310 exclu du graphique sectoriel seulement.
Couverture ce mois-ci. 0 des 8 831 offres n'avaient pas de code SCIAN; 326 offres d'agence exclues de la vue sectorielle.
Chômage. Statistique Canada, tableaux 14-10-0354-01 (taux régionaux de l'assurance-emploi) et 14-10-0287-01 (EPA mensuelle de l'Ontario). Prestataires de l'assurance-emploi. Tableau 14-10-0323-01 (le mois de référence est deux mois avant le mois de données).
Salaires. Salaire horaire médian affiché tiré de WE Data (anciennement YNJ); affiché, et non versé.
Eye on the Labour Market · Un œil sur le marché du travail
Eastern Ontario Training Board · Commission de formation de l'Est ontarien
16 Second Street West, Cornwall, Ontario · 613.932.0210 · 16, rue Second Ouest, Cornwall (Ontario)